
Mobility is one of the most important aspects of urban geography. It is the behavioural manifestation of the structure of any inhabited space. Different cities across the world display radically different patterns of mobility depending on a variety of factors. These factors are predominantly of a structural nature, for example the configuration of road networks, the presence of public transportation infrastructure, and the spatial relationship between residential and commercial hubs. However, there are other factors which can also play a significant role in shaping mobility patterns such as perceptions of safety, class differences, property prices or governmental strategies. To better understand mobility within Brasília and the Distrito Federal, several methods of data collection and observation were employed.
Methods
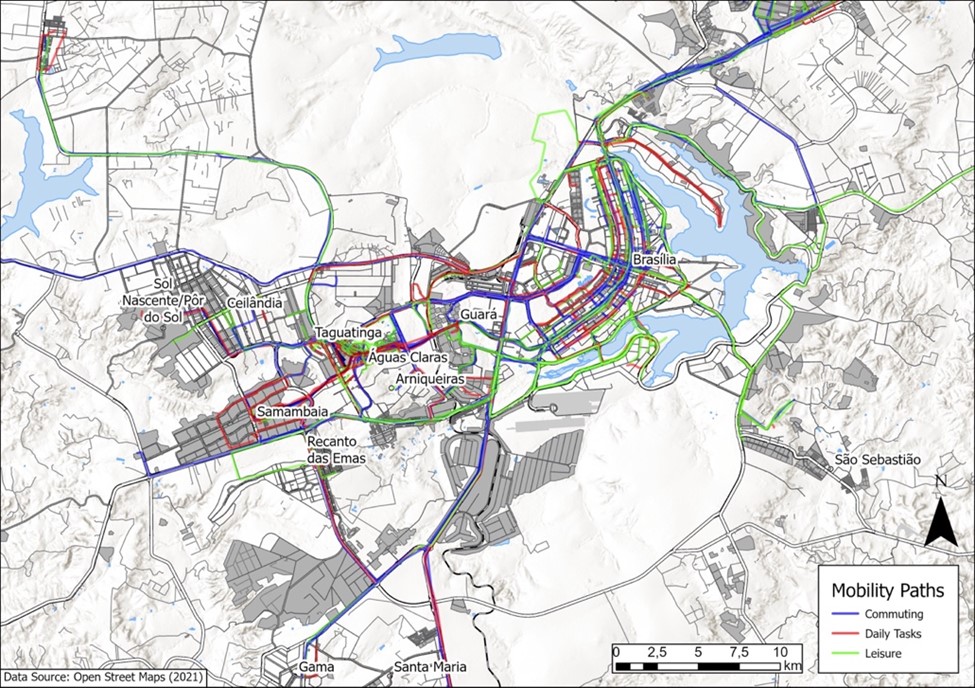
Different methods were used to research mobility in Brasília. The first and primary method was a questionnaire made up of open and closed questions. In order for the evaluation process to be simplified and less time-consuming, a large number of open questions are usually avoided in standardized questionnaires (Häder 2010). After preparation and some pre-tests, the questionnaires were filled out in Plano Piloto and Águas Claras by randomly chosen members of the public. The second method was to observe a road crossing. An observation form was prepared for this task. In order to grasp the subject of the investigation as precisely as possible, the researcher must first of all pay close attention to the events and processes within the situations (Bortz et al. 2016). In addition to asking residents to answer questions regarding their mobility behaviour and choices, they were also asked to quickly sketch their general mobility patterns within the city onto a provided map. This method was partially inspired by the work of Vajjhala and Walker (2010), who used participative and cognitive mapping in combination with GIS techniques to determine strategies for transport prioritisation. In addition, the methodology partially followed guidelines outlined in the methodological framework for analysis of participatory mapping compiled by Fagerholm et al. (2021). Respondents used three different coloured pens; a blue pen for everyday commutes between home and school or place of employment, a red pen was used to sketch daily activities such as shopping and accessing services, and a green pen was used to indicate mobility associated with leisure activities. These sketches were then digitalised into line features using GIS software, the results of which can be viewed below (Figure 1). This provided the basis for several spatial analyses, combining qualitative evaluations of mobility infrastructure and norms with empirically collected spatial data.
Results
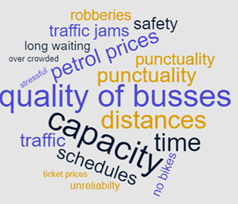
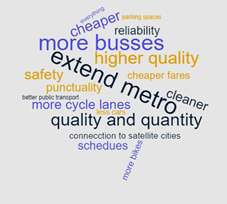
By analysing the data collected via the three methods and then interpreting this data with the help of a general understanding of life in the Distrito Federal gained over the course of the research excursion, a number of patterns and trends relating to mobility were identified. In the following two graphics (Figure 2; Figure 3), the main challenges surrounding the topic of mobility and the desires of the population to improve the current situation of the mobility network are shown.
The role of different modes of transport
The evaluation of the questionnaires shows that a majority of the population has access to a car. Moreover, about
half of them use a car daily. These two aspects result from the fact that Brasília was designed for car use. When
people do not use their cars, it is mainly because of the fuel costs and the traffic. Brasília was initially
designed for fewer people than currently live there. This results in a lot of traffic. Cars are the preferred form
of transport when travelling to the Plano Piloto. This is due to negative aspects associated with public
transportation. Generally, only people who do not own a car use public transport. Nevertheless, many people would
give up their car if they had to pay for parking, indicating a clear financial incentive in decision-making. In
Águas Claras, mobility is also dominated by cars. Here, however, many also walk as there are more sidewalks than
in Plano Piloto. During the Corona pandemic, mobility was reduced, and cars were used to avoid close physical
contact to others.
Bicycles are a popular mode of transportation in many European cities such as Amsterdam, Copenhagen and
Innsbruck. Short distances can be covered quickly, and it is an environmentally friendly mode of transportation.
Brasília is characterised by long distances between points of interest. The heat and lack of shade in the city
make commuting by bike an unpleasant proposition for many people. There is however the possibility that the
car-dominated capital might become more bike-friendly in future. People commuting by bicycle often criticise the
inadequate road safety. The networks of bike paths are still being developed. A relatively new addition to this
bicycle infrastructure comes in the form of shared city bikes. Many people said that they use them on a regular
basis but criticise the small number of available rental bikes. The rental stations are often empty, which
demonstrates high demand.
Due to the lack of a metro line to the Asa Norte, many people, especially students, use bicycles in this
part of the city. Students often take public transport to the Rodoviária do Plano Piloto and continue their
commute to the Universidade de Brasília (UnB) by bike. For a better insight into this behaviour, we rented a bike
and experienced it ourselves. The findings can be seen in
the map.
When asked to review the public mobility system in Brasília, people laughed and told us we should not use
public transport because it is horrible, slow, and unpredictable. The public transport system consists mainly of a
bus and metro network. In the Plano Piloto, the metro has two lines which run parallel to each other through the
Asa Sul. The Asa Norte has no connection to the metro system. Many residents rely on the often-overcrowded bus
network. Busses that have reached their maximum capacity and arrive late are some of the main critics of the local
population. The costs of both bus and metro are higher than in other major Brazilian cities. This is a further
reason why many people choose to use their own car over using public transport.
Brasília was planned by Lúcio Costa to be a futuristic, modernist city, and the car was placed in the
center of his transportation concept. Huge six-lane highways cross the city center. Clover-like road designs are
designed to help the flow of traffic by avoiding intersections and red lights. As a consequence of this
“car-oriented thinking”, pedestrians were neglected. Nonexistent sidewalks force pedestrians to walk along busy
highways and cross them in risky places. It is not unusual that pedestrians must wait up to five minutes (often in
the scorching sun) at pedestrian crossings. The huge distances in the highly dispersed city of Brasília make it
difficult to travel by foot. The long distances for daily commutes and shopping, combined with the heat, force the
people to use their car or public transport.
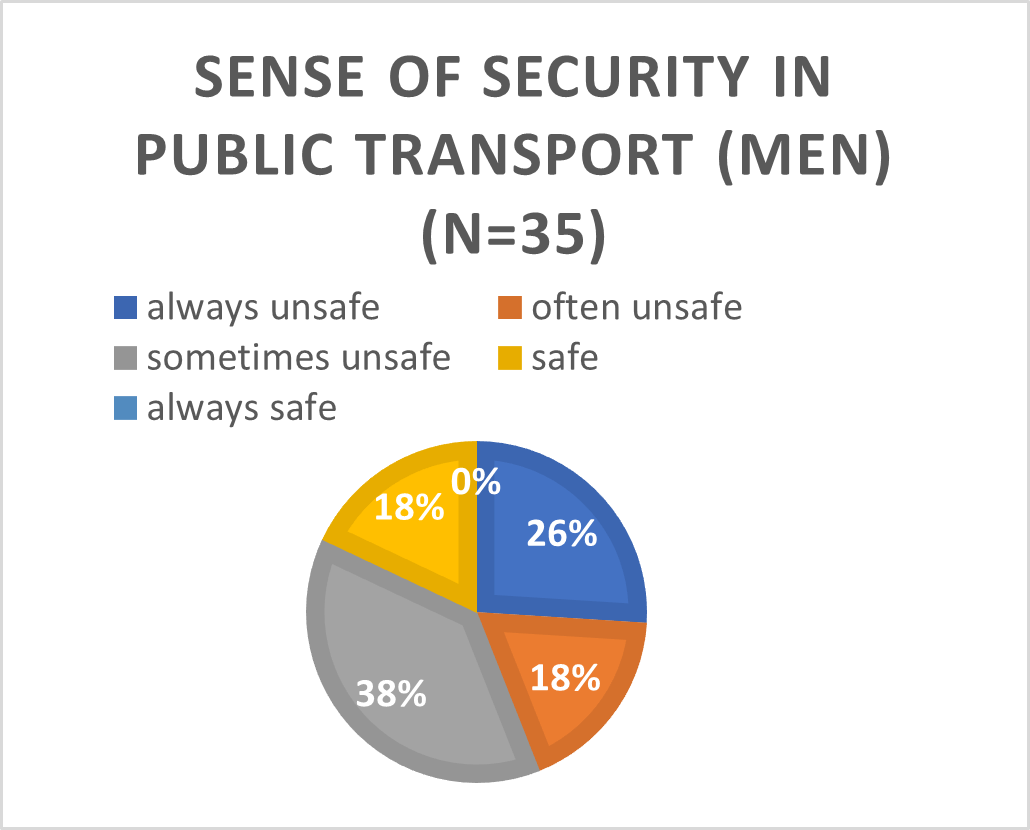
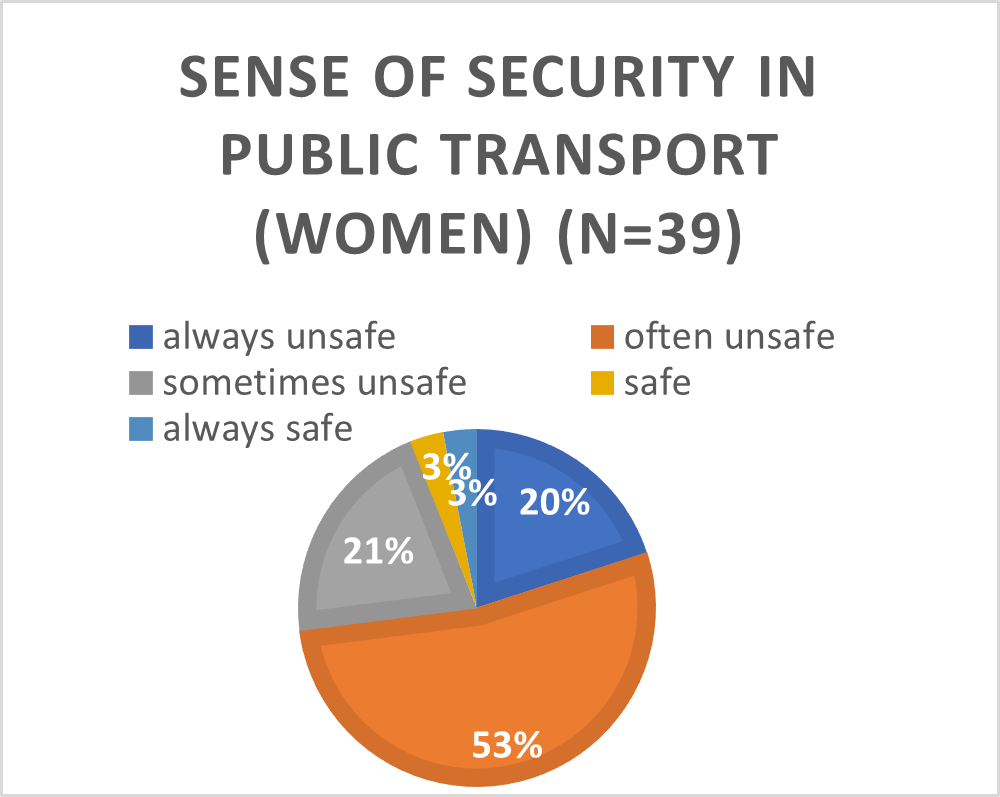
While asking people why they choose their personal car over public transport, perceptions of safety was
one of the most common themes: many people don't use the metro or bus because they don't feel safe during their
journey. A difference in the safety awareness between men and woman is also evident, as can be seen in the
following visualisations (Figure 4).
Mobility patterns
No relationship was discovered between whether a participant owned a car and the average distances they travelled to commute, complete daily tasks, or partake in leisure activities. Similarly, no relationship could be seen between the gender of respondents and their average path distance. In the case of age, there was no significant relationship between the average path distance and the age of the participants. It is likely that these consistencies are due to the somewhat rigid structure of the city: no matter how one travels, the same long distances are inevitable. Interestingly, when the mean path distance of participants was investigated according to education type, a pattern emerged showing that the higher the level of education, the lower the degree of mobility (Figure 5).
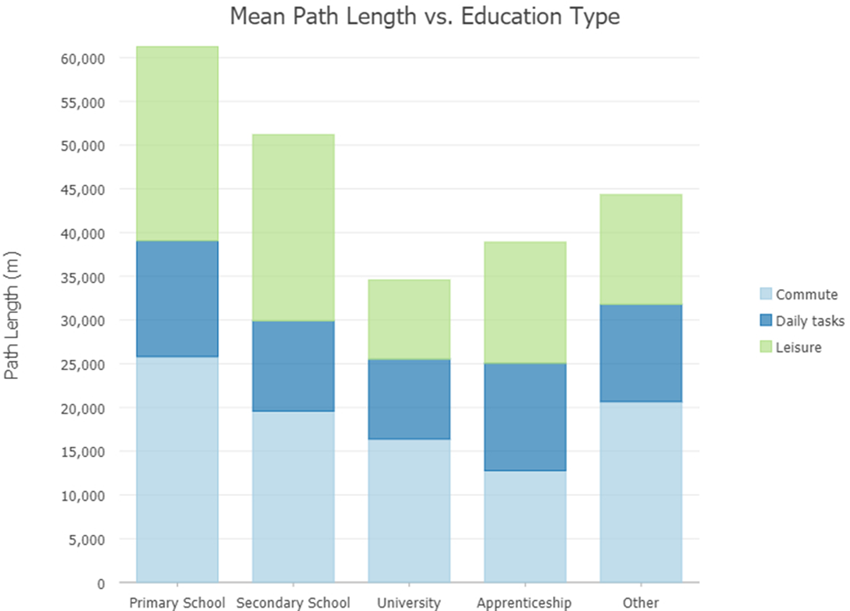
This is likely because persons of a higher education level and thus socioeconomic status are more likely to live centrally, whereas people with a more basic level of education are more likely to live outside of Plano Piloto and travel longer distances towards the urban centre for professional, educational, or recreational purposes. This explanation relies on the assumption that those with a higher educational level are more likely to belong to a higher socio-economic bracket and are thus more likely to be able to afford the higher property prices and cost of living found closer to the Plano Piloto.
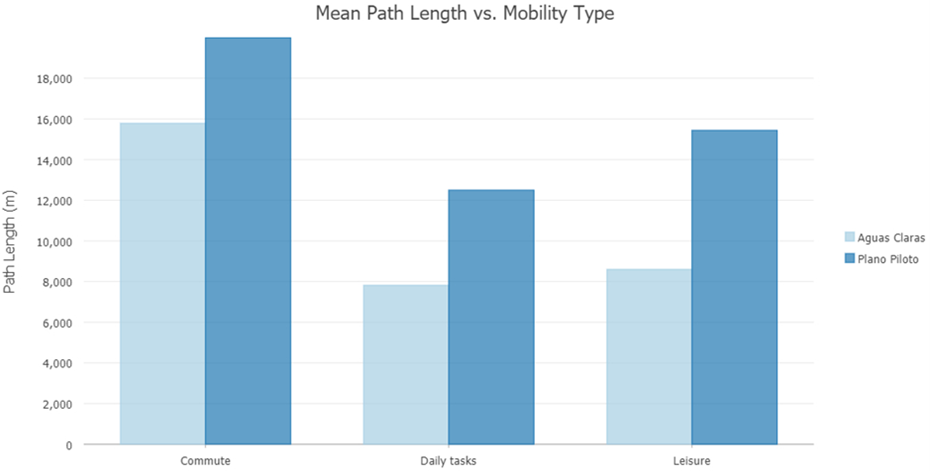
When participants in Águas Claras and participants in the Plano Piloto are compared, the mobility paths of those in the Plano Piloto are significantly longer than those in Águas Claras (Figure 6). A possible explanation for this discrepancy may be that the Plano Piloto represents an area which offers greater economic and leisure appeal, drawing in people from further afield. In terms of daily tasks, there is a significant difference in the average path length for people questioned in Águas Claras and the Plano Piloto. It seems likely that this is a result of the more “organic” functional development of satellite cities such as Águas Claras, resulting overall in shorter distances between people’s homes and the areas where they go grocery shopping and complete other daily tasks.
Conclusion
As with all cities, the mobility patterns in Brasília are highly complex. Being a so-called “planned city”, it is to be expected that the way people move around will always be heavily influenced by the founding concept and initial structure as it was conceived in the middle of the last century. Although as a rule it is a city which is dominated by individual automobile transport, this overall perception can at times obscure the more intricate mobility patterns of its inhabitants, which vary not only in different parts of the city, but also depending on socio-economic factors such as educational level and gender. It appears that there is a perceptible desire amongst residents for changes to be made to the mobility infrastructure, to create a city which is healthier, more walkable, better connected and more egalitarian in terms of its mobility. This desire for change seems however to coexist with a certain attitude of acceptance regarding the realities of mobility in Brasília. The adaptation on the part of the population to the unconventional structure of the city has resulted in the adoption of corresponding mobility behaviours, which play a role in lending the Brazilian capital its unique character.
Video
The struggle for pedestrians crossing the road can be seen in this video. Up to 5 minutes can be spent crossing large intersections.
All illustrations, graphics, tables and photos used in connection with the topic Mobility as well as the present text were
created or taken by Christian Wolf, Joseph Fischler and Timothy Eastwood.
References
Fagerholm, Nora; Raymond, Christopher M.; Olafsson, Anton Stahl; Brown, Gregory; Rinne, Tiina; Hasanzadeh, Kamyar; Broberg, Anna; Kyttä, Marketta (2021): A methodological framework for analysis of participatory mapping data in research, planning, and management. In International Journal of Geographical Information Science 35 (9), pp. 1848–1875. DOI: 10.1080/13658816.2020.1869747.
Häder, Michael (2010): Empirische Sozialforschung. Wiesbaden: VS Verlag für Sozialwissenschaften.
Vajjhala, Shalini P.; Walker, Wendy M. (2010): Roads to Participatory Planning: Integrating Cognitive Mapping and GIS for Transport Prioritization in Rural Lesotho. In Journal of Maps 6 (1), pp. 488–504. DOI: 10.4113/jom.2010.1086.